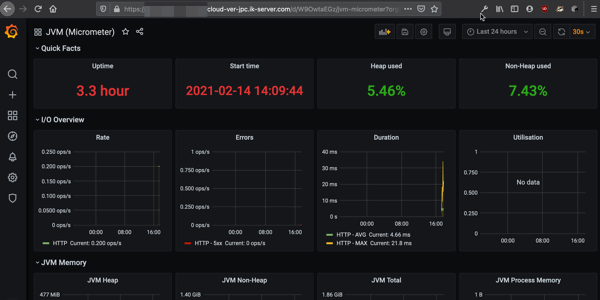
Add Grafana to your Spring / Quarkus application using Jelastic
Monitor your Java application with charts and alarms
Part 1: Grafana
Grafana is becoming a respectable (standard?) solution to monitor Java application in enterprise environments.
In this tutorial we will see how to setup an environment to monitor Spring / Quarkus applications using Grafana and Prometheus.
In the first part we will configure Grafana.
Grafana Installation with Jelastic
We use Jelastic to install Grafana. Jelastic is the Duke's Choice Award Paas 2018, in my opinion the best solution for Java Cloud applications.
Your provider's configuration and prices could change from this example.
Marketplace
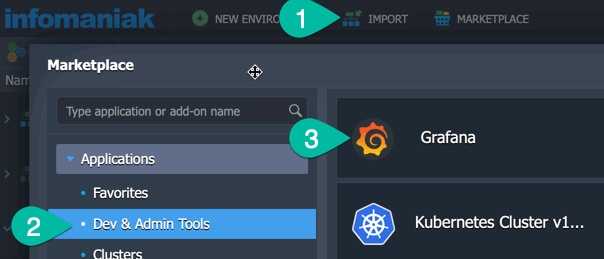
In the marketplace you can find hundreds of preconfigured setups, we are looking for Grafana.
Grafana setup
We choose Grafana OpenSource (Enterprise is available too) and we can customize our environment name. This will be the URL of our server.
If you are using Grafana for your enterprise you could be interested in the SSL and custom domain features (here unchecked).
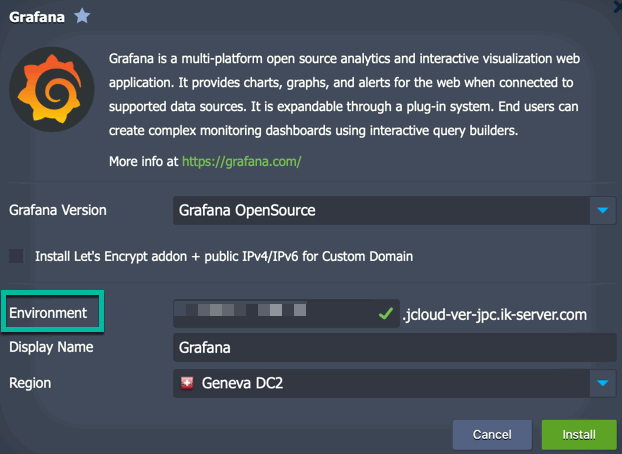
Click on install and wait a few minutes.

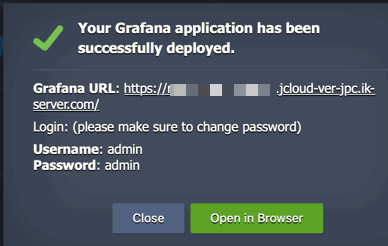
... and we receive the confirmation in Jelastic (and by email) ...
Grafana environment
Your Grafana environment is now ready to be used.

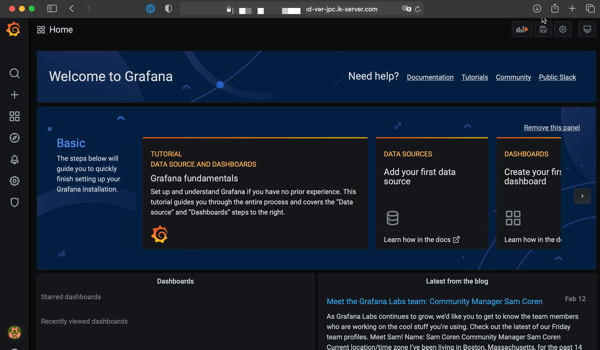
After the first login you will have to change the initial password.
Jelastic configuration

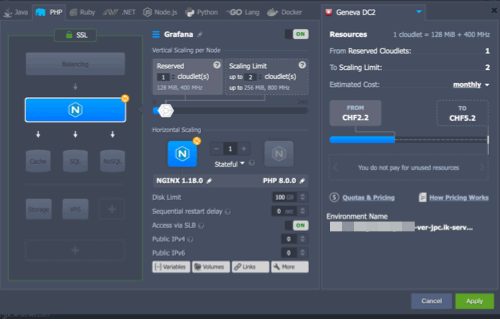
Grafana is installed under the PHP tab ... this is curious because Grafana is a Go application and Jelastic can deploy Go applications.
I recommend changing the original setup of Jelastic for the number of instances available to the Grafana server.
In my case, it was configured to use between 512 and 2048 MB. For my usage it was excessive.
Next steps: Prometheus, Spring, Quarkus
Soon the second part with Prometheus and Spring. Prometheus gave us some surprises for the installation in Jelastic.
Sneak preview
